
What is a spectrogram?
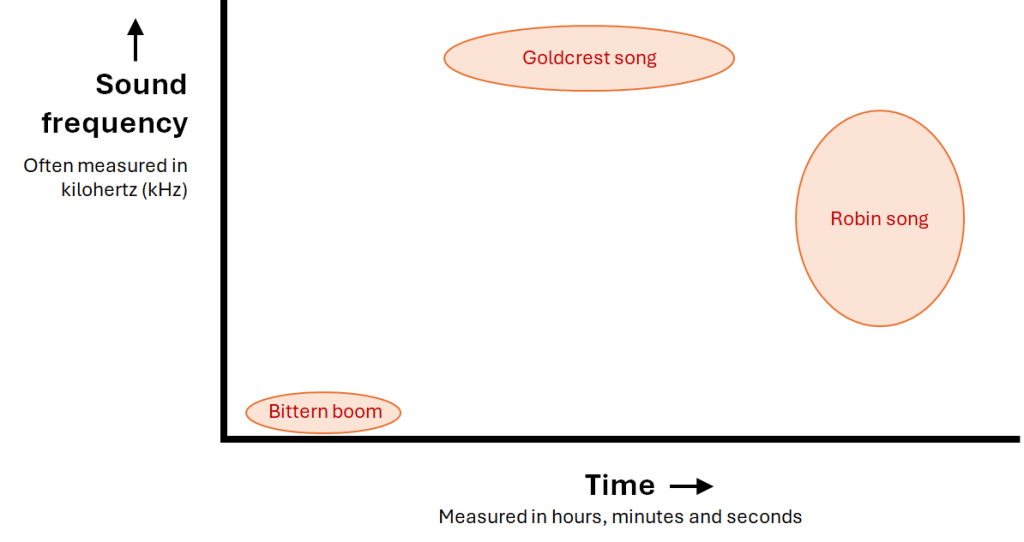
A spectrogram is a visual representation of sound. Its two main axes are time running left to right, and sound frequency (or pitch) running from bottom to top. Patterns of shading or colour within the spectrogram represent the amount of energy (which you can think of as volume) at a particular time and frequency. For example, a low frequency sound like a booming Bittern would be visible at the bottom of a spectrogram whereas a high pitch (=high frequency) sound like a singing Goldcrest would be visible at the top of a spectrogram. The song of a Robin, would fall somewhere in between these in frequency terms. In addition to the positions of the sounds on the spectrogram, the shapes on the spectrogram also convey meaning, with the wide-ranging Robin song spanning more frequency range than Goldcrest.
The pattern on a spectrogram is like a fingerprint of the sound. If two bird songs sound different, they will look different on a spectrogram. Indeed often it is possible to see differences between sounds that our ears struggle to resolve. The rest of this post will show example spectrograms and sounds and explain what they show.
An artificial sound
Below is a 30 second section of a spectrogram produced in Audacity using its default colour scheme, where blues indicate quieter sounds, ranging through to intense pinks being louder sounds. The vertical axis shows frequencies (from 0 to 10kHz) and the horizontal axis shows time (from 14:00 to 14:30 mins).

There are several things to note in this spectrogram. Firstly, notice the fuzzy, featureless pink bands along the bottom in the 0–2kHz frequency range. This is the distant low frequency rumble or roar of road traffic and a common feature on many urban or suburban sound recordings. Above these bands is an obvious feature of interest: near-parallel lines showing a gradual rise, fall and another rise in frequency over a period of about 6 seconds. This oscillation is characteristic of the siren of an emergency vehicle! There are a few other features – some pink stippling in the blue across the frequency range is probable wind noise through trees, and some vertical lines which are broad spectrum clicks (interference or other non biological sounds).
Flight calls of thrushes
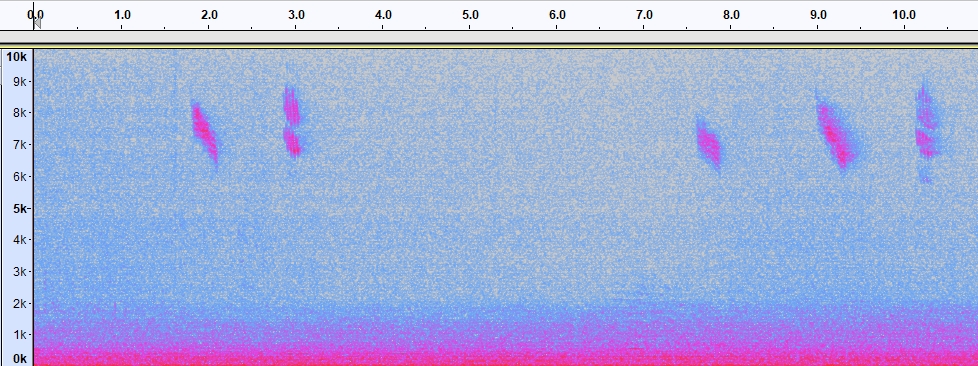
The spectrogram below is an 10 second extract from October 2017 and shows five distinct calls. All are relatively high pitch, around 7–9kHz. The calls have distinct shapes, with three being angled downwards (like grave accents) and two being shorter and of more constant frequency. These and other features help to identify the former as Redwing calls and the latter as Blackbird calls. Often superficially similar sounding calls are visually distinct in spectrograms. Examples of spectrograms of calls of common UK nocturnal migrants can be found on the Identification pages.
<– Back to Processing
